
April 2025: The Market Wasn’t Fragile Because of Tariffs. Tariffs Hit a Fragile Market.
On April 7, 2025, the VIX hit 60.13 — the highest since COVID. Everyone blamed Trump’s tariff threat. Our data tells a different story.


Disclaimer: This article describes analytical frameworks for informational and research purposes only. We do not provide investment, financial, or trading advice. State classifications describe current conditions based on quantitative rules and historical patterns, not predictions. Past performance does not guarantee future results.
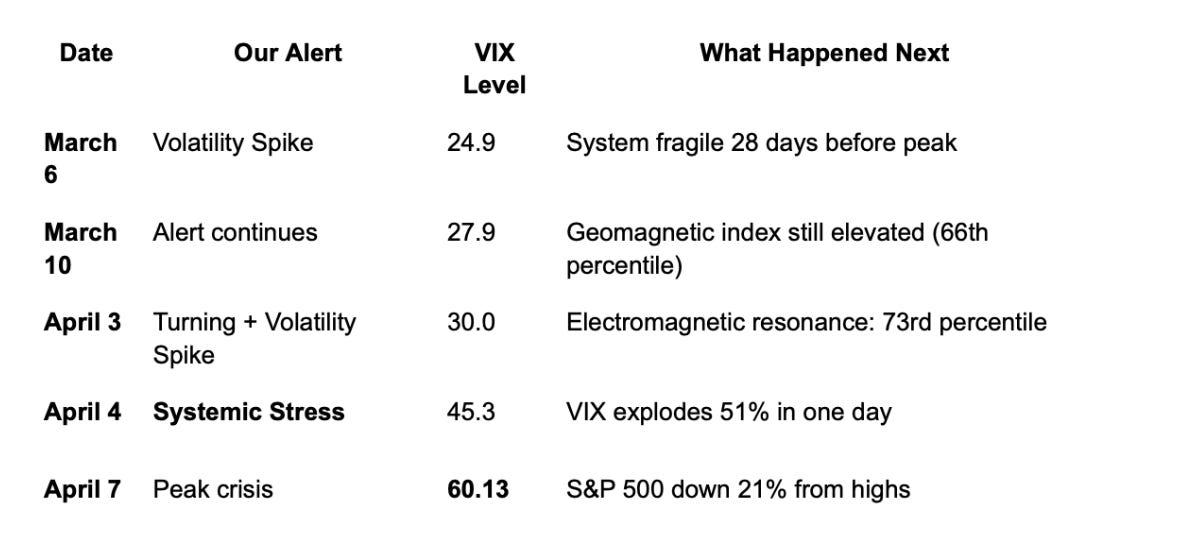
March 6, 2025 — Four Weeks Before the Crash
VIX: 24.9. Markets look fine. No tariff panic yet.
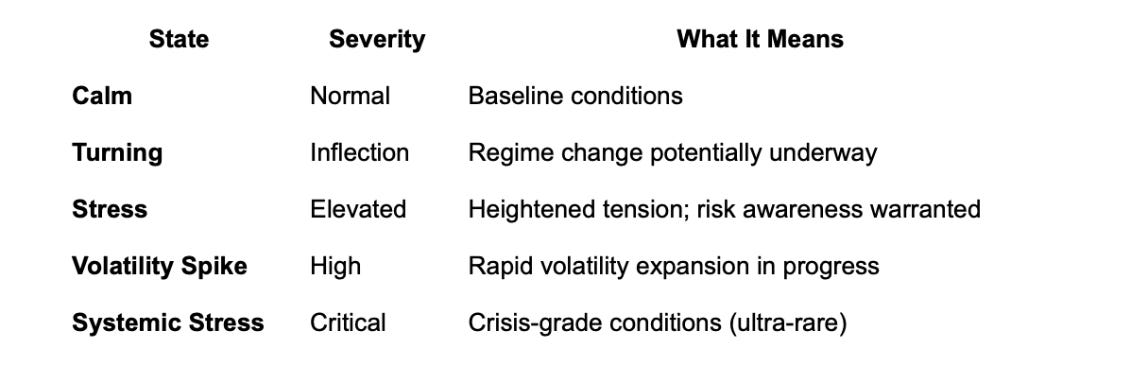
Our system flags Volatility Spike conditions.
Not because we predicted Trump’s announcement. We didn’t know about tariffs any more than you did.
We flagged it because our environmental indices — tracking geomagnetic activity, solar flux, and atmospheric conditions from NOAA and NASA — showed readings that historically correlate with market fragility.
The numbers that morning:
Geomagnetic Activity Index: 70th percentile (elevated)
Proprietary Environmental Tension Composite: Extreme levelshistorically associated with crisis episodes
Four weeks later, VIX exploded to 60. The S&P 500 fell 21% from its February peak.
The question nobody asked: Was the market vulnerable before the tariff news?
The Timeline Everyone Remembers vs. What We Saw
What the headlines said:
“Trump tariff threat crashes markets” — April 2025
What our environmental data showed:
We didn’t predict tariffs. We detected that the environmental backdrop was loaded 28 days before the trigger fired.
The tariff announcement was the spark.
Our data says the kindling was already dry.

This Sounds Insane. Until You Read What the Federal Reserve Found.
In 2003, researchers at the Federal Reserve Bank of Atlanta published a working paper that nobody in finance wanted to talk about.
Title: “Playing the Field: Geomagnetic Storms and the Stock Market”
Finding: Unusually high levels of geomagnetic activity have a negative, statistically and economically significant effect on stock returns across all U.S. market indices.
They tested 70 years of data. The correlation held across:
All U.S. indices
International markets
Multiple time periods
After controlling for seasonality, weather, and behavioral factors
The mechanism they proposed:
Geomagnetic storms correlate with mood disturbances — depression, anxiety, altered risk perception. Traders affected by storms may misattribute their discomfort to economic conditions rather than environmental factors, leading to relatively higher demand for safe assets and downward pressure on stocks.
This isn’t astrology. Each step has peer-reviewed support:
Geomagnetic activity affects human biology (NASA tracks it for astronaut safety)
Mood affects risk judgments (Johnson & Tversky, 1983)
People misattribute environmental discomfort (Schwarz & Clore, 1983)
The Federal Reserve researchers documented the correlation. They didn’t prove causation. But the pattern was too strong to ignore.

So We Tested It
If environmental factors influence collective decision-making before they show up in price data, that’s a different class of signal.
Most quantitative models are closed-loop: they predict price from price derivatives. Technical indicators, volatility surfaces, order flow — all derived from market data.
Valuable signals. But fundamentally lagging.
The Market State Detector is an open-loop system that incorporates environmental data alongside market structure filters.
Five regime states:
Environmental inputs:
Geomagnetic Activity (NOAA Kp/Ap indices — same data the Fed researchers used)
Solar Flux (NASA F10.7 cm radio flux)
Electromagnetic Resonance (derived from solar data)
Proprietary Environmental Tension Composite (under active research)
Then we validated it over 13 years of market history. Not with in-sample curve-fitting. Walk-forward validation. Forward-only scoring. Every classification timestamped and auditable.
13 Years of Validation: The Track Record
If environmental factors genuinely influence market fragility, our classifier can provide earlier context than price‑derived indicators in some cases.Here’s what 13 years of walk-forward validation showed:
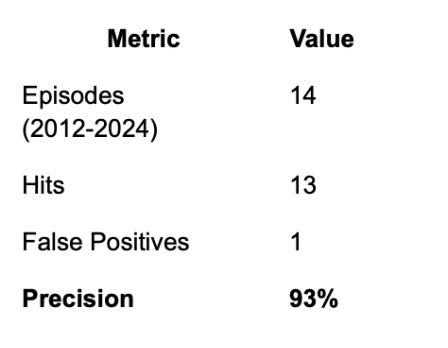
Systemic Stress State (Crisis Detection)
The most selective state. Only fires when multiple factors align in patterns historically associated with severe dislocations.
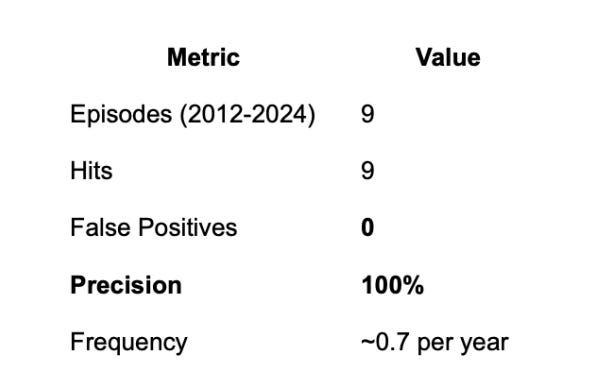
Historically captured key crisis episodes (9/9 within the 2012–2024 window)
Volatility Spike State (Rapid Expansion Detection)
A distinct state from Systemic Stress — designed to catch sudden volatility events that spike hard but don’t necessarily threaten the entire system.
Notable episode: Volmageddon (February 2018)
The VIX ETF implosion. VIX doubled in a single day from 17 to 37. XIV (the inverse VIX ETN) collapsed 90% and was terminated.
Our system flagged Volatility Spike conditions, not Systemic Stress.
Correct call. Volmageddon was a rapid volatility expansion in a specific market segment (volatility products), not a systemic crisis. The S&P 500 recovered within weeks. Markets distinguished between a structural break in one product category versus broader system failure.
This distinction matters: Different regime states for different kinds of stress. Not everything that moves fast is systemic. The classifier knew the difference.
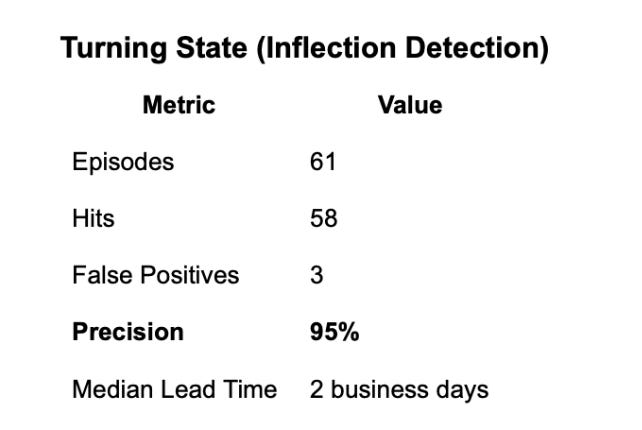
Turning State (Inflection Detection)
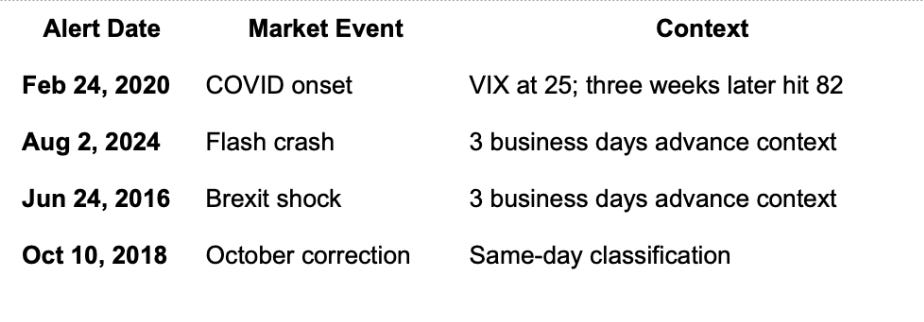
Case Study: COVID (February 24, 2020)
Most people think COVID “crashed markets in March 2020.”
Our system saw it differently.
February 24, 2020 — We flag Systemic Stress conditions.
Context that morning:
VIX: ~25 (elevated but not alarming)
S&P 500: Still near all-time highs
Headlines: COVID spreading in Italy/South Korea, but no market panic yet
What our environmental indices showed:
Geomagnetic Activity: Elevated (above 70th percentile)
Environmental Tension Composite: At levels historically seen only during crisis episodes
Three weeks later: VIX hit 82. S&P 500 fell 34%.
We didn’t predict the pandemic. We detected that environmental conditions matched historical crisis patterns before traditional indicators triggered.

Case Study: August 2024 Flash Crash
Friday, August 2, 2024 — We flag Systemic Stress.
Markets looked stable heading into the weekend. Bloomberg terminals showed normal volatility.
Monday, August 5, 2024 — Global markets convulsed. VIX spiked. Portfolios caught flat-footed.
We provided three days of advance context — including the weekend for scenario planning.
Not because we predicted what would happen Monday. Because the environmental backdrop matched historical fragility patterns.

Back to April 2025: What Really Happened?
Everyone has an opinion about the April selloff. “Trump’s tariffs crashed the market.”
True. But incomplete.
Our environmental data showed elevated readings starting March 6th — 28 days before VIX peaked — when tariff concerns weren’t dominating headlines yet.
The Federal Reserve paper documented that geomagnetic activity correlates with mood misattribution. People attribute environmental discomfort to economic prospects.
If collective risk perception was already stressed due to environmental factors, the tariff news may have landed in an already-compromised decision-making environment.
Hypothesis: Environmental conditions don’t cause market crashes. They may amplify the market’s response to whatever trigger eventually fires.
The same tariff threat landing during calm environmental conditions might have produced a different magnitude response.
We can’t prove that. But it’s consistent with:
The Federal Reserve research (returns during low geomagnetic activity are substantially higher)
Our 13-year validation data
The April timeline (environmental flags 28 days before news-driven peak)
The tariff threat was the spark. The environmental data says the kindling was already dry.

The Theoretical Chain (Hypothesis, Not Proven)
Solar/Geomagnetic Activity
    → Atmospheric/Ionospheric Changes
    → Subtle Physiological Effects at Population Scale
    → Shifts in Risk Perception & Decision Latency
    → Collective Decision-Making Patterns
    → Market Regime State Change
Each step has peer-reviewed support:
Human magnetoreception: Wang et al., Nature (2019) — light-dependent magnetosensitivity in human cryptochrome proteins
EEG modulation from geomagnetic fields: Mulligan et al., eNeuro (2023) — alpha-band modulation at Earth-strength field levels
Autonomic function: Palmer et al. (2006) — heart rate variability correlations with geomagnetic activity
Mood and financial decisions: Loewenstein et al. (2001) — risk perception shifts under altered emotional states
We’re not claiming to have proven this chain operates in markets.
We’re observing that tracking the first step (environmental conditions) correlates with the final output (market regime states) — validated out-of-sample over 13 years.

Cross-Domain Validation: It’s Not Just Markets
If environmental factors genuinely influence collective behavior, the same signals should correlate with stress episodes in other domains.
Research has found correlations between geomagnetic activity and:
Hospital ER admissions (cardiovascular, psychiatric) — Oraevskii et al. (1998)
Pilot error and aviation incidents — Usenko (1992)
General population autonomic function — Kuleshova et al. (2001)
Replication across domains (health, infrastructure, finance) reduces the probability of spurious correlation. If the same environmental signal correlates with stress across multiple independent systems, it suggests an exogenous driver.
What This Does NOT Mean
We are not claiming:
Causation — We observe correlations, not proven mechanisms
Prediction — We classify current conditions, not future prices
Trading signals — This is not investment advice
Guaranteed accuracy — Past performance ≠ future results
What we ARE observing:
Markets may not operate as purely closed systems. Environmental factors that influence human cognition at population scale appear to correlate with market regime states — consistent with Federal Reserve research and validated over 13 years.
Implications: Trigger vs. Backdrop
Traditional analysis focuses on triggers: What news caused the selloff?
This framework adds a second question: What was the environmental backdrop when the trigger fired?
The same fundamental news may produce different magnitude responses depending on whether it lands in a fragile or resilient environment.
April 2025 wasn’t just about tariffs. It was about tariffs hitting a system that was already showing stress patterns in environmental data 28 days earlier.
That’s not prediction. It’s measuring the present more carefully than price-based indicators alone.
Verification Available
The full backtested historical track record (2012–2024) is available for independent verification.
Every classification is timestamped, versioned, and auditable. Rule definitions are SHA-256 hashed. Forward-only scoring. Walk-forward validation.
See the complete backtested historical track record →www.mindforge.tech/evaluate

The Future is Unknowable. The Present is Measurable.
Most quantitative models measure the present through price — signals that are coincident or lagging by construction.
The Federal Reserve research suggested an alternative: environmental factors that may influence collective decision-making before they manifest in market data.
We built a system to test whether these factors could inform market regime classification.
Over a 13+ year backtested historical period, the results suggest they can:
100% precision on crisis-grade conditions (9 for 9, 2012–2024 historical backtest)
95% precision on inflection points (58 of 61, 2012–2024 historical backtest)
Approximately four weeks of advance context in April 2025 (Mar 6 → Apr 7, calendar days) — 2025 preliminary observational analysis (not part of the 2012–2024 validation)
This doesn’t mean we’ve solved market prediction. We haven’t.
It means we may have found a way to measure the backdrop against which market events unfold — the environmental conditions that make systems fragile or resilient.
When the tariffs hit in April, everyone focused on the trigger.
Our data suggests the kindling was already dry.
References
Krivelyova, A., & Robotti, C. (2003). “Playing the Field: Geomagnetic Storms and the Stock Market.” Federal Reserve Bank of Atlanta Working Paper 2003–5b.
Kay, R.W. (1994). “Geomagnetic storms: Association with incidence of depression as measured by hospital admission.” British Journal of Psychiatry, 164, 403–409.
Wang, C.X., et al. (2019). “Transduction of the geomagnetic field as evidenced from alpha-band activity in the human brain.” eNeuro.
Johnson, E.J., & Tversky, A. (1983). “Affect, generalization, and the perception of risk.” Journal of Personality and Social Psychology, 45, 20–31.
Schwarz, N., & Clore, G.L. (1983). “Mood, misattribution, and judgments of well-being.” Journal of Personality and Social Psychology, 45, 513–523.
Palmer, S.J., et al. (2006). “Geomagnetic activity, extremely low frequency magnetic and electric fields and human health at the Earth’s surface.” Surveys in Geophysics, 27, 557–595.
Important Disclosures
This article is for informational and research purposes only and does not constitute investment advice, financial advice, trading advice, or any other sort of advice. Market state classifications describe current conditions based on quantitative rules and historical patterns, not predictions of future events.
Backtested performance has inherent limitations and does not represent actual trading. Past performance is not indicative of future results. No representation is being made that any account will achieve results similar to those shown.
Mindforge Intelligence, LLC is not a registered investment adviser. All classifications should be independently evaluated within your own risk-management framework.
© 2025 Mindforge Intelligence, LLC. All rights reserved.