
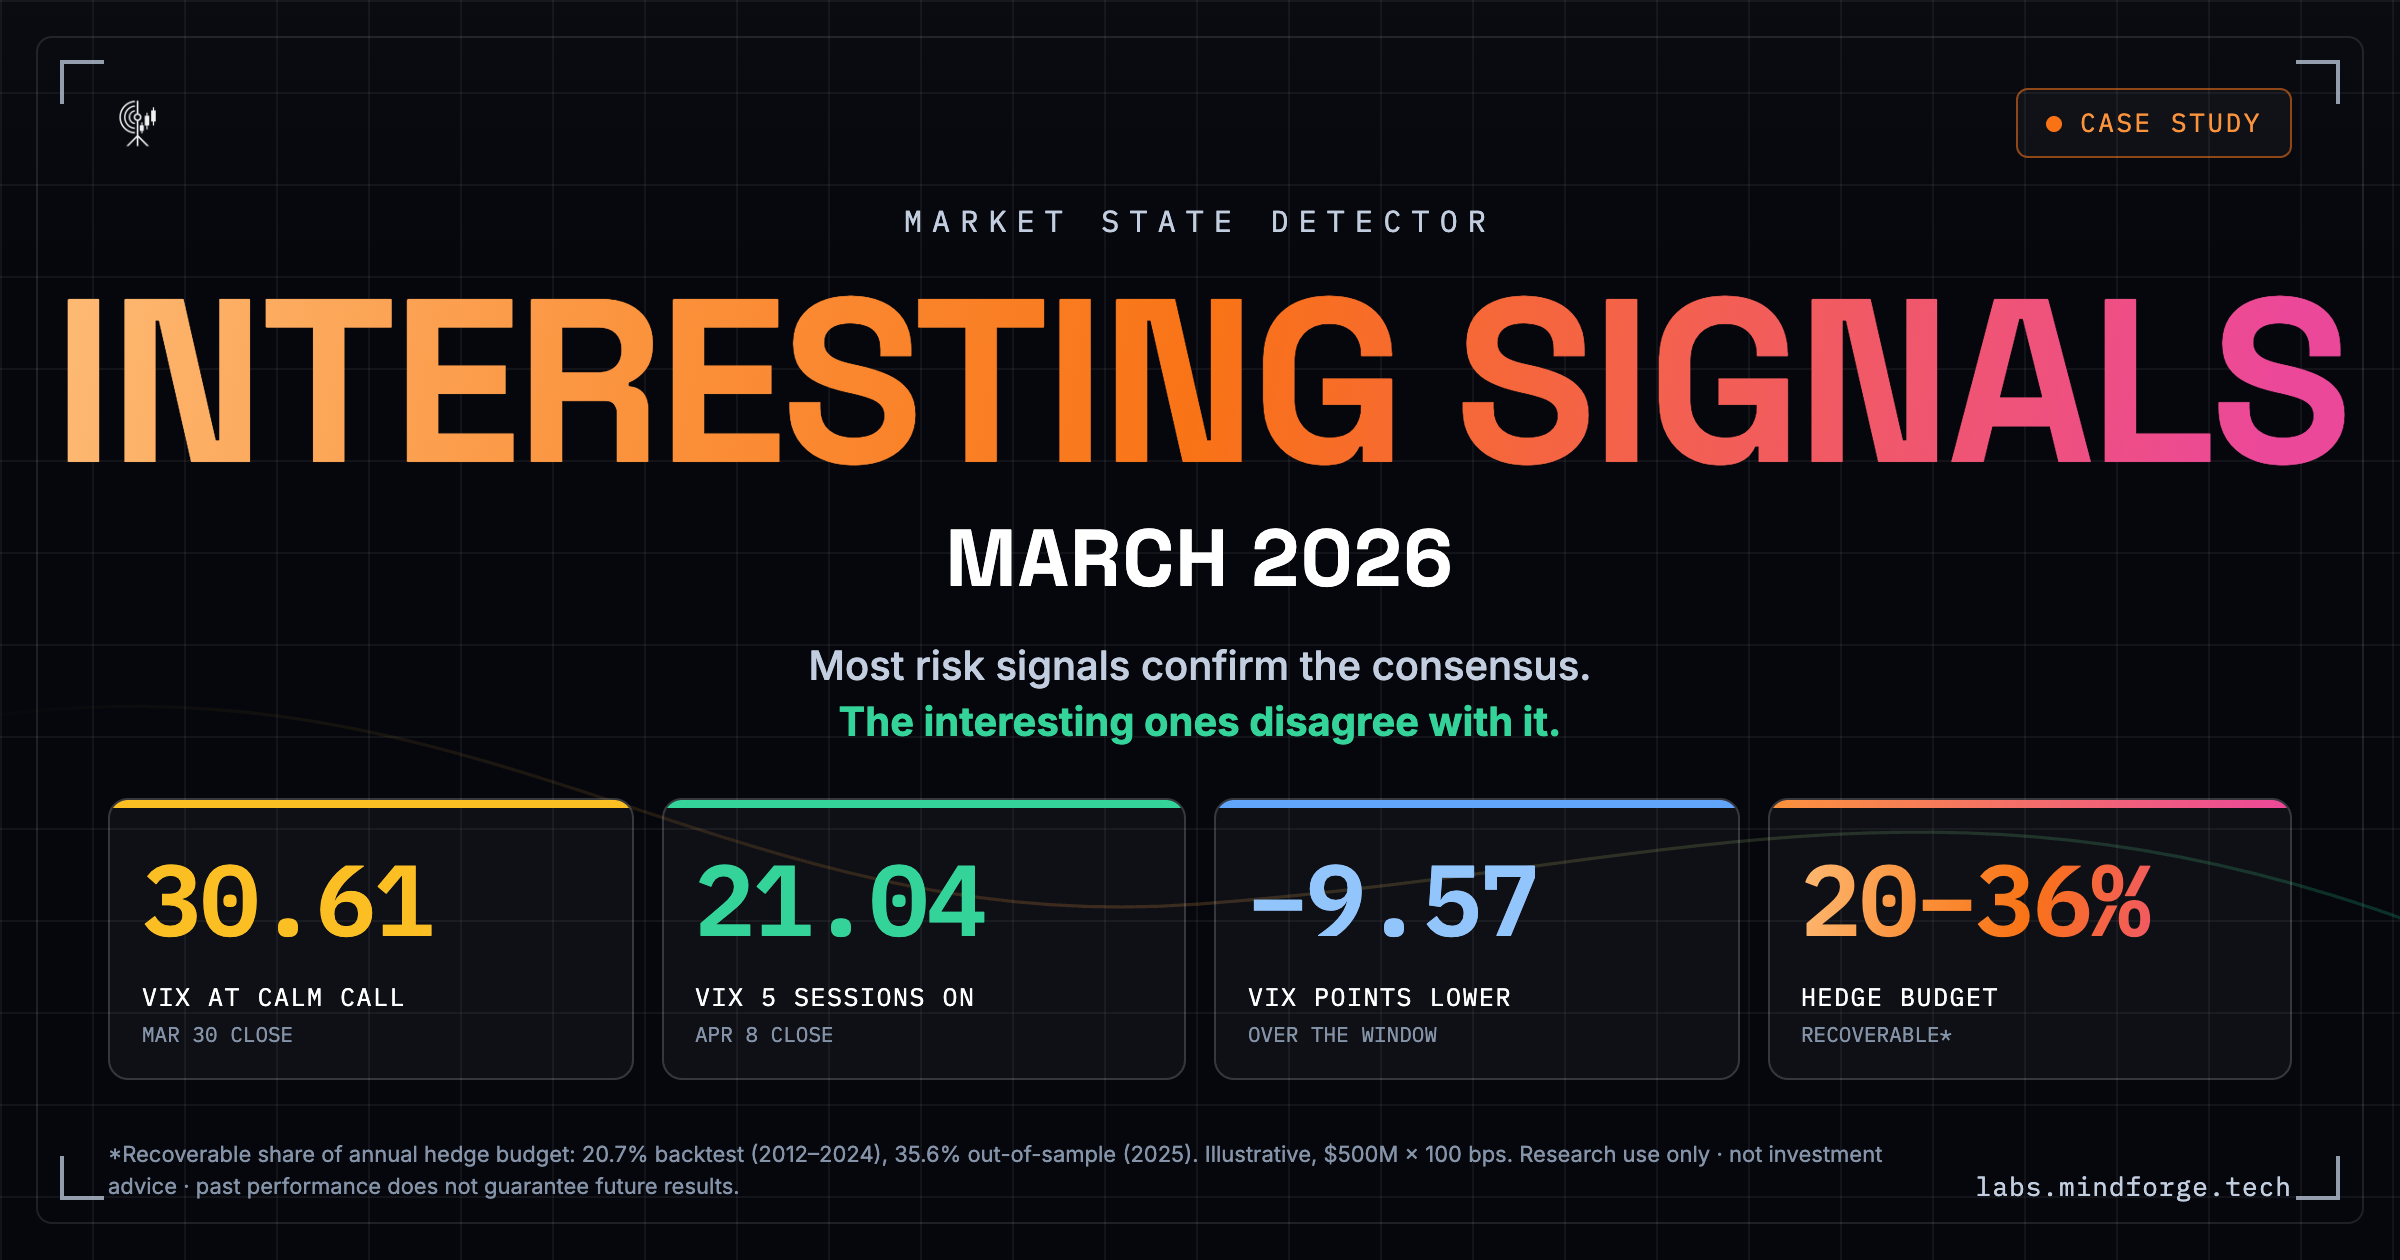
Most Risk Signals Confirm Consensus. The Interesting Ones Disagree With It. March 2026 Was an Interesting One.
Most risk signals just confirm the consensus. They have to — they're computed from it.

The interesting moments, the ones worth writing about, are when a signal updates on a different clock and disagrees with the consensus while it still holds. Those moments are rare. When they happen, they are also the only data points where “signal diversification” is doing the work the desk is paying it to do.
March 2026 produced one.
The Illusion the Desk Lives With
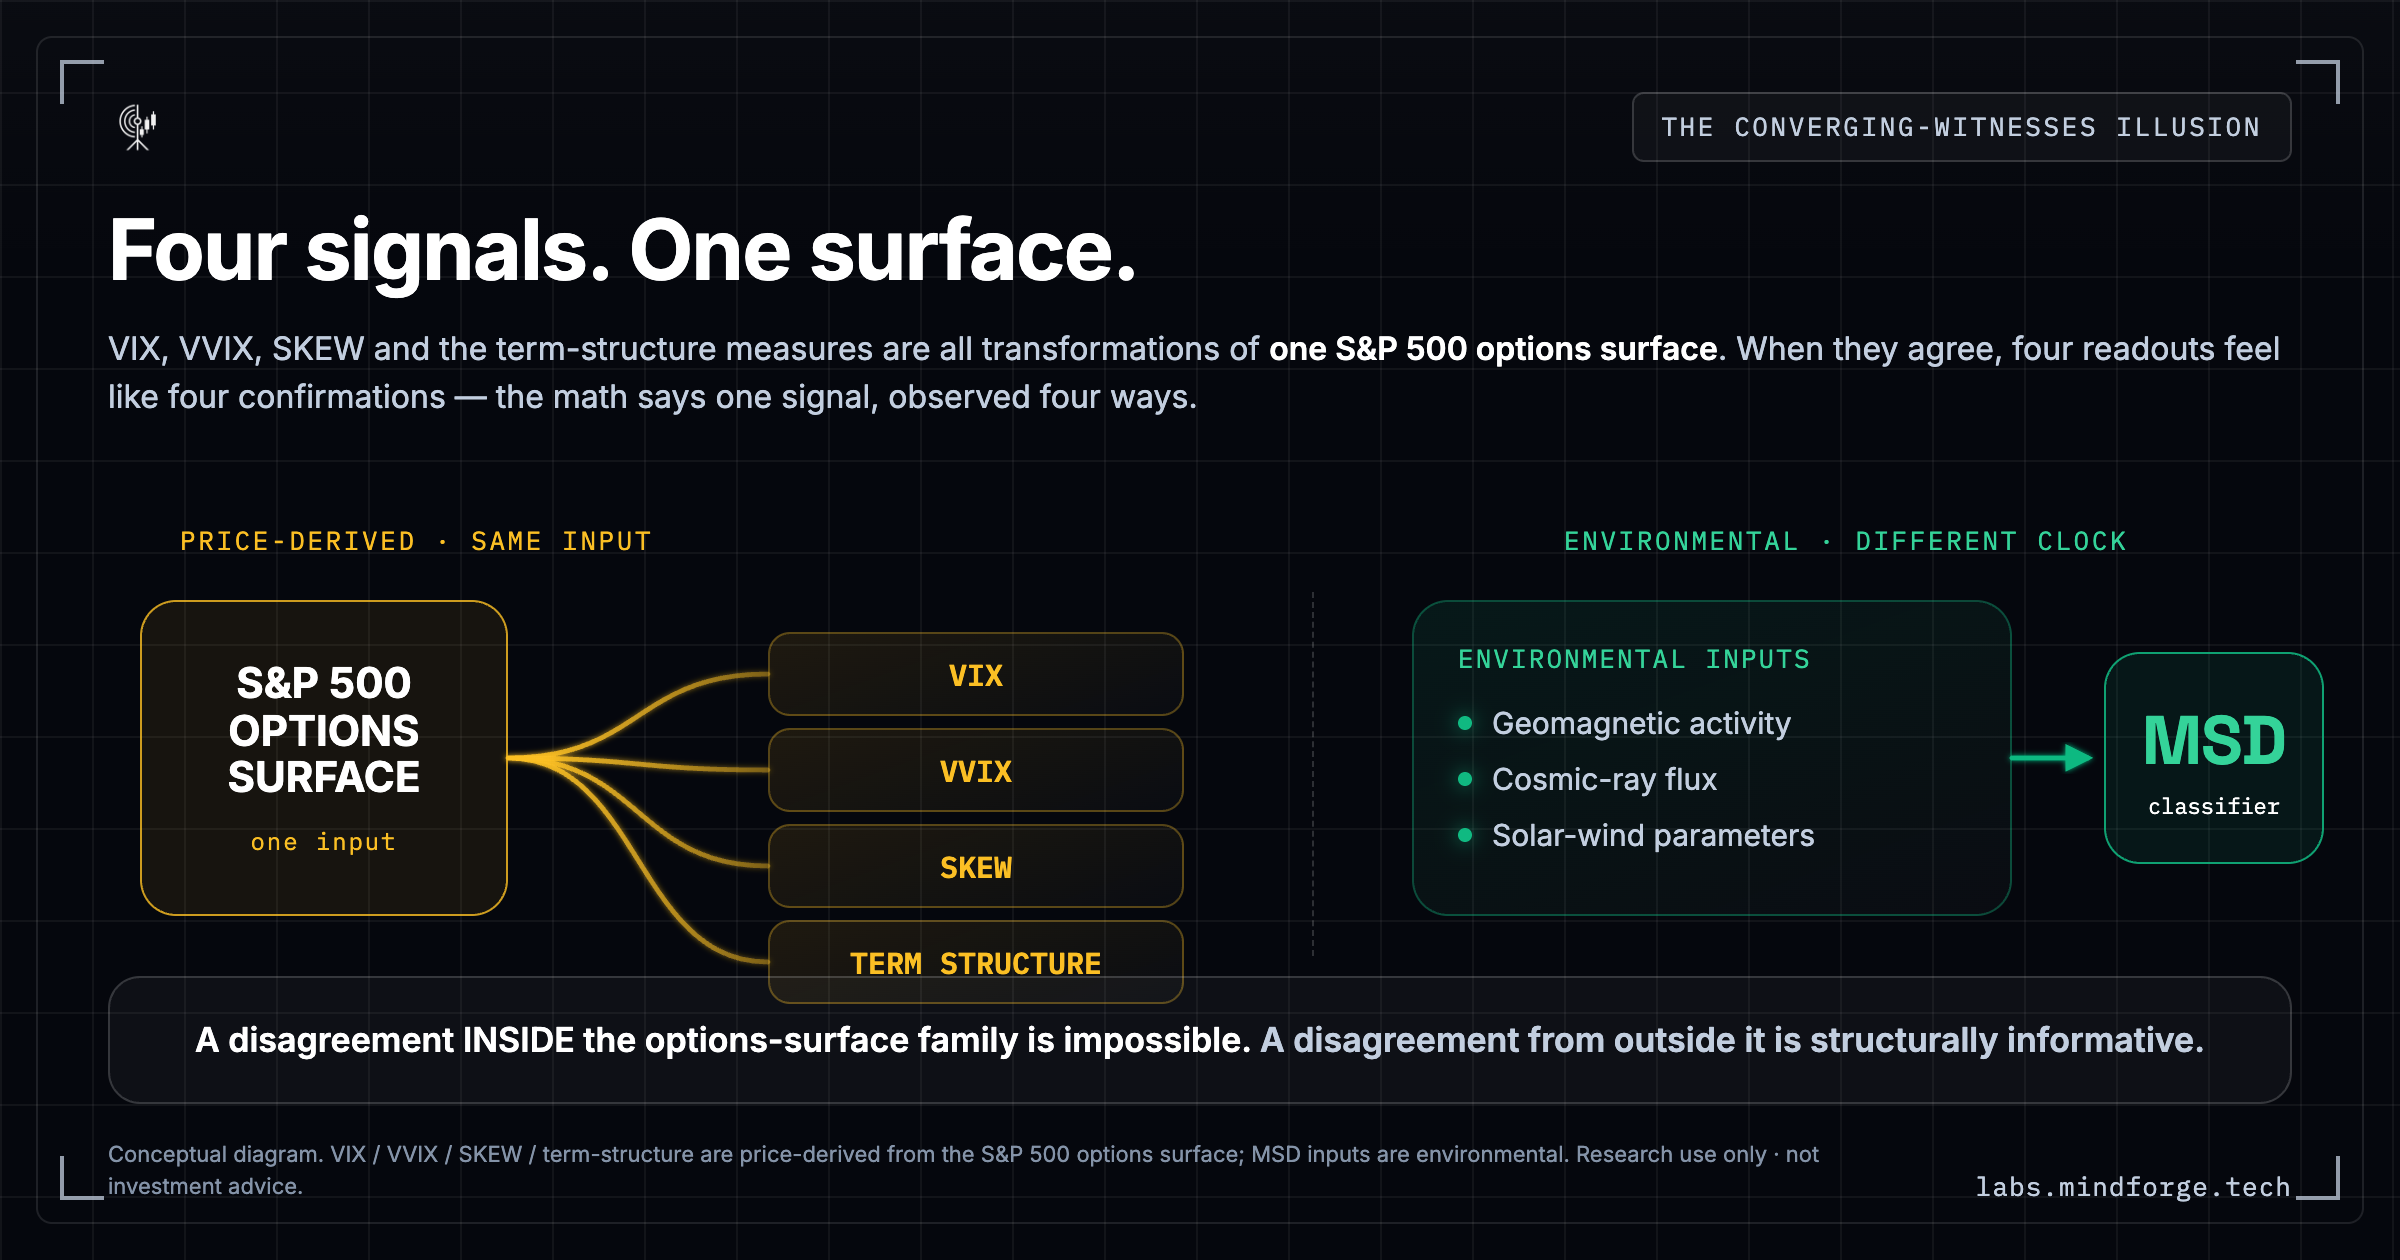
The trap with conventional volatility indicators isn’t that quants don’t know they share inputs. Every desk knows VIX, VVIX, SKEW, and the term-structure measures are all transformations of the same S&P 500 options surface. The trap is that knowing the math doesn’t stop the converging-witnesses illusion during a crisis.
When all four of those signals say the same thing during a stress event, the desk feels three independent confirmations of the first. The math says one signal observed four ways. The pattern-recognition part of the brain says four signals all agreeing. The math loses. Every position the desk wants to take against the apparent consensus has to be defended internally to PMs, to a CIO, to a risk committee — and most desks do not defend. The illusion holds operationally even when it does not hold mathematically.
The only thing that breaks the illusion in real time is a signal whose inputs are not on the options surface — not in any market data feed at all. When such a signal disagrees with the converging chorus, the disagreement is structurally informative in a way that no disagreement inside the options-surface family can be. Those are the moments worth paying attention to.
The Episode
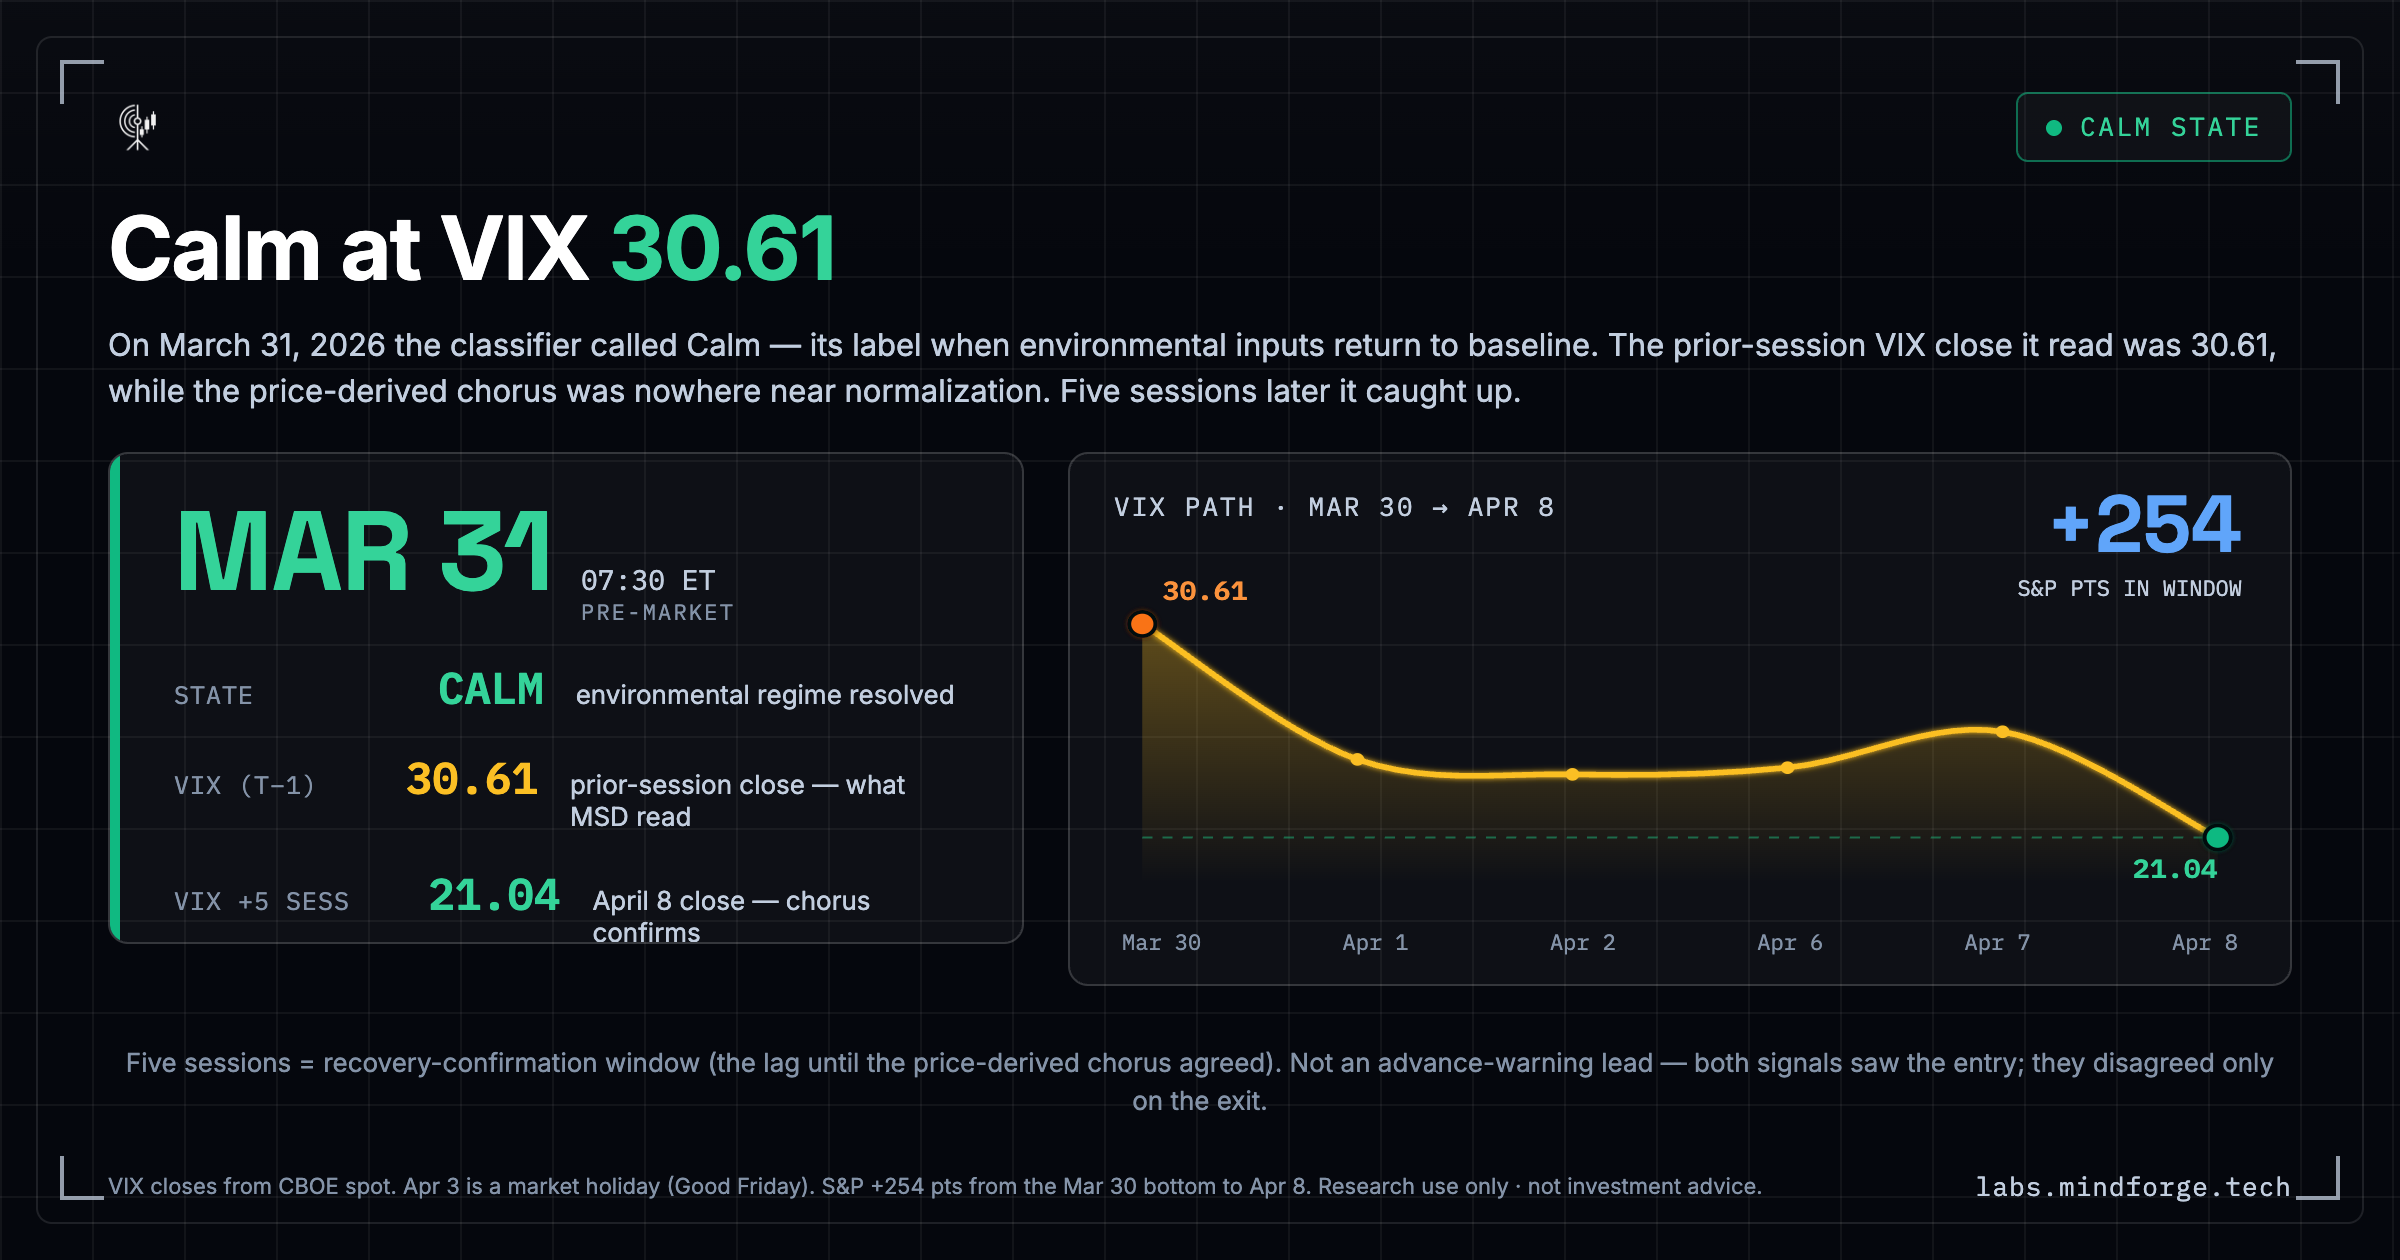
On March 31, 2026, the prior session’s VIX close — the data the classifier was reading — was 30.61. A classifier whose inputs are ambient environmental measurements — geomagnetic activity indices, cosmic ray flux measurements, solar wind parameters, and related physical-environmental data — said the regime had normalized. The alert went out before the market opened.
The classifier had been running across the full 28-day Iran-shock episode: the late-February operation in which Ali Khamenei was killed and the Strait of Hormuz closed, the resulting 8% S&P peak-to-trough drawdown, the VIX peak of 31.05 on the March 27 close, the South Korean circuit breakers, the oil spike above $100. For most of the episode, the classifier and the price-derived chorus moved in the same direction. They agreed: the regime was elevated, the risk was real.
On March 31 they disagreed on the exit.
The Independent Clock: The classifier said Calm — in its taxonomy, the regime label it issues when its environmental inputs return to baseline.
The Consensus: The chorus did not agree. VIX, the term-structure measures, the implied-vol surface — none of the price-derived signals were anywhere near normalization on the data the classifier had used.
The Resolution: Five trading sessions later, on April 8, VIX closed at 21.04. The S&P had recovered 254 points from the bottom. The chorus had caught up to the call.
A note on framing for any reader running the math against their own data: the five-session count is a recovery-confirmation window, not an advance-warning lead. Both signals saw the entry into stress in early March; they agreed throughout the escalation; they disagreed only on the exit. The five sessions measure the lag between when the classifier confirmed normalization and when the price-derived chorus did.
What Those Five Sessions Cost
The institutional question is not whether the disagreement was clever. Disagreements between signals happen constantly; most are noise. The question is what the disagreement cost, on the assumption that the desk was hedged through the episode and would only have begun unwinding when the price-derived chorus confirmed normalization.
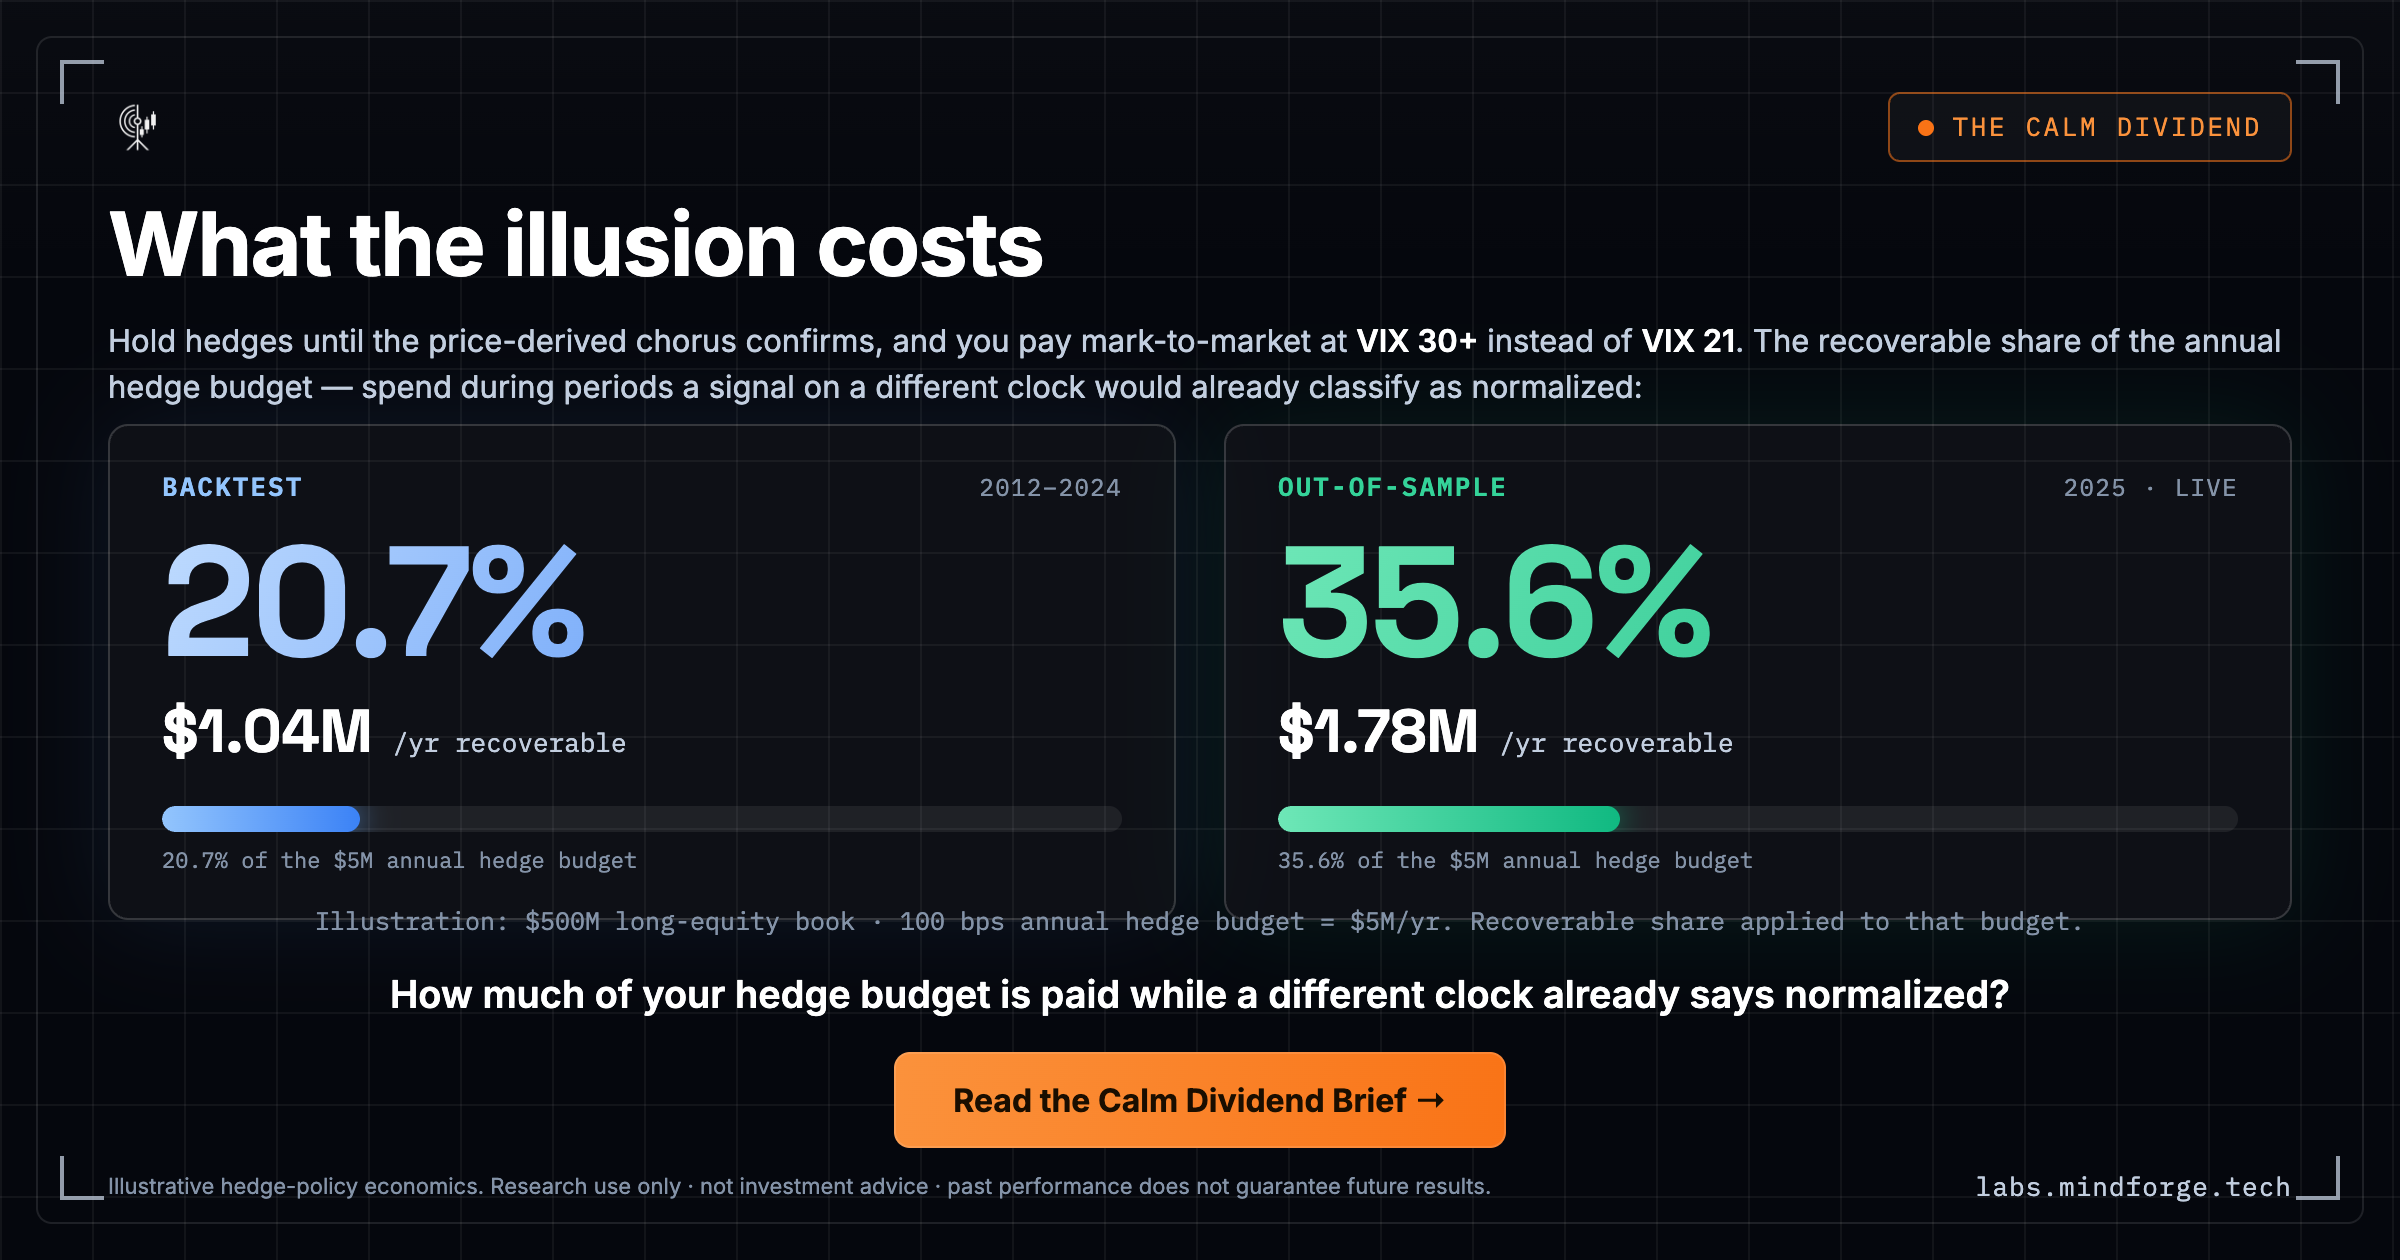
Paying mark-to-market on volatility hedges at VIX 30+ instead of VIX 21 for five trading sessions is a real number. The exact number depends on program structure, instruments, position sizing, and book size. The pattern doesn’t.
To quantify the baseline pattern, we use a standard institutional illustration:
The Baseline: A $500 million long-equity book running a 100 basis-point annual hedge budget is spending $5,000,000 per year on volatility protection. During an extended stress regime, that book is paying daily marks reflecting current VIX. Marks at VIX 30+ are expensive. Marks at VIX 21 are not.
The Historical Backtest (2012–2024): Across the canonical historical illustration on those assumptions, the recoverable portion of annual hedge budget — the share spent during periods when a signal on a different clock would already have classified the regime as normalized — totals roughly 20% (~$1,000,000).
Live Out-of-Sample (2025): In the out-of-sample period — the first year the classifier ran in live production — the recoverable portion was closer to 36% (~$1,800,000) on the same illustration.
The five sessions in March 2026 are one observation within that larger pattern. They are not the entire case. They are also one of the cleanest, because the chorus and the classifier had spent the entire month agreeing and the disagreement was sharp. An institutional reader can do the math against their own program without needing this post to do it for them.
What This Analysis Is Not Claiming
Three things, plainly.
It is not claiming the classifier always anticipates VIX by five sessions. Lead times distribute across episodes; some are negative; some episodes were missed entirely. The published historical record across 2012–2024 reports the full distribution, not a curated average. The March 2026 episode is one observation within a long record that includes both early calls and failure modes.
It is not claiming an institution should have unwound hedges on March 31. The classifier names regimes; it does not name positions. Whether a regime call translates into a position change depends on the mandate, the risk tolerance, the downside cost of being wrong in either direction, and the discretion of the risk officer. None of that is in the classifier’s scope.
It is not claiming price-derived volatility indicators are without value. They are excellent at confirming what the consensus believes once the consensus has formed. The narrow argument is that they are not designed to disagree with consensus, because they are computed from consensus.
The Question This Leaves on the Desk
Most risk signals just confirm the consensus. The only interesting ones are those updating on a completely different clock.
The question for a risk officer reading this is not philosophical. It is operational: how much of your annual hedge budget is being paid during periods when a signal on a different clock would already have flagged the regime as normalized?
The math is institution-specific. The framework is general. The brief walks through both.
Read the canonical hedge-cost illustration and the assumptions behind it: [The Calm Dividend Brief →]

Research use only. Not investment advice. Past performance does not guarantee future results. The figures cited describe historical backtest behavior and out-of-sample testing of an illustrative hedge policy. Actual institutional outcomes depend on individual programs, instruments, position sizing, and execution. Full disclaimers: mindforge.tech/disclaimers